RTP Realities: Decoding Slot Returns, Table Probabilities, and Live Dealer House Edges Across Platforms
RTP Realities: Decoding Slot Returns, Table Probabilities, and Live Dealer House Edges Across Platforms

Unpacking RTP: The Core of Slot Machine Returns
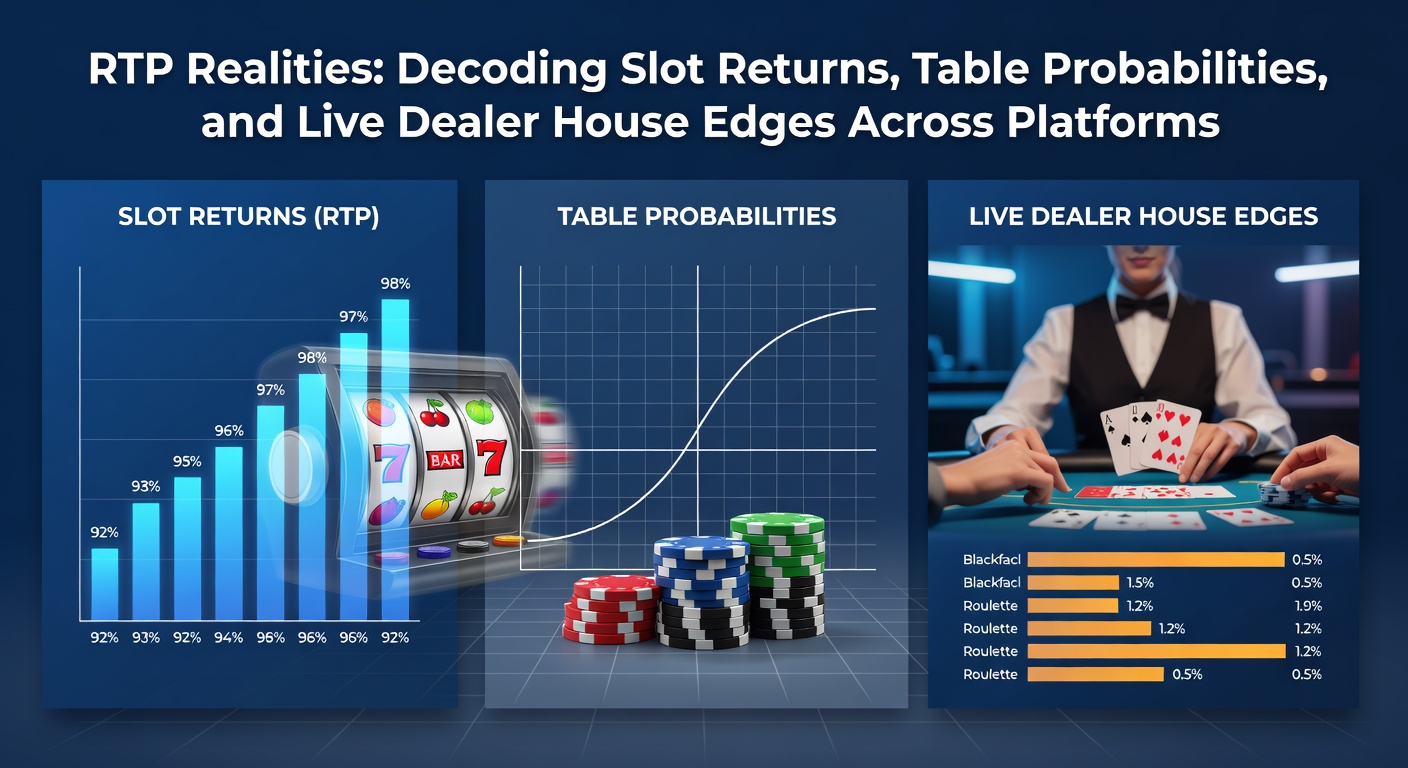
Slots dominate online casino floors, and their Return to Player (RTP) percentages reveal much about long-term payout potential; developers like NetEnt and Microgaming typically design games with RTPs ranging from 92% to 98%, meaning for every $100 wagered, players theoretically get back $92 to $98 over millions of spins, although short-term variance swings wildly due to random number generators ensuring each spin stands independent. Experts who've dissected provider data point out that high-volatility slots, such as those chasing massive jackpots, often hover around 93-95% RTP, while low-volatility counterparts push closer to 97-98%, balancing frequent small wins against rarer big hits.
What's interesting is how platforms aggregate these figures; operators in regulated markets must disclose average RTPs per category, and data from the New Jersey Division of Gaming Enforcement for early 2026 shows online slots averaging 96.2%, up slightly from 95.8% the prior year because newer titles incorporate player-favorite features like cascading reels and multipliers without sacrificing returns. Take Starburst, a staple with 96.09% RTP, or Gonzo's Quest at 95.97%—these classics hold steady across sites, but branded games tied to movies sometimes dip to 94% owing to licensing costs baked into the math.
And yet, land-based slots tell a different story; physical machines in Nevada casinos, as tracked by the Nevada Gaming Control Board, average 88-92% RTP, lower than online versions because higher operational overheads like venue maintenance demand steeper house advantages, a gap that's widened as digital platforms optimize for lower costs and higher volumes.
Table Games Breakdown: Probabilities That Shape Strategy
Table games shift focus from pure RTP to precise house edges and win probabilities, where blackjack leads with edges as low as 0.5% under optimal basic strategy—players hitting 99.5% returns if they follow charts dictating hit, stand, double, or split based on dealer upcards and their hand totals—while roulette's European single-zero wheel carries a 2.7% edge, climbing to 5.26% on American double-zero variants due to that extra green pocket tilting odds further against bettors. Baccarat simplifies matters with banker bets at 1.06% house edge, player at 1.24%, and ties a risky 14.36%, explaining why sharp players stick to the banker side despite commissions.
Observers note that online RNG tables mirror these edges faithfully; craps, for instance, offers pass line bets at 1.41% with odds backing slashing it near zero, and video poker variants like Jacks or Better reach 99.54% RTP with perfect play, but only if players master paytable nuances across 9/6, 8/5, or full-pay machines. Platforms differentiate through side bets—those flashy extras like blackjack insurance at 7.4% edge or Pai Gow Poker bonuses pushing effective edges over 5%—which lure casual players but erode returns, a pattern research from industry analysts confirms across U.S. iGaming hubs.
But here's the thing: multi-hand options and tournament formats on apps boost volume without altering core probabilities, allowing skilled grinders to minimize variance over sessions that stretch hours, much like one poker pro who documented logging 10,000 hands of online blackjack to validate that 0.5% edge in real play.
Live Dealer Dynamics: House Edges in the Spotlight
Live dealer games blend RNG precision with human elements, streaming real croupiers from studios in places like Latvia or the Philippines, yet house edges stay consistent—live blackjack mirrors its digital twin at 0.5-1% depending on rules like 6:5 payouts versus 3:2, while roulette wheels spun by pros hold the same 2.7% European edge, verifiable through slow-motion replays and outcome logs that platforms provide for transparency. Baccarat live tables shine here, with 1.06% on banker bets drawing high-rollers who appreciate the ritual of card squeezes, although chat features sometimes distract, subtly impacting decisions.
Turns out, production costs nudge live edges a hair higher than pure RNG; data indicates live roulette averaging 2.8-3.0% across major sites, attributable to fewer betting options or regional wheel biases, and poker variants like Ultimate Texas Hold'em carry 2.2% edges on ante bets, climbing with play decisions that demand edge-sorting savvy. One study from European gaming researchers found live blackjack sessions yielding 0.7% effective edges in practice, as players deviate from strategy amid social banter, underscoring how atmosphere influences outcomes without changing math.
So platforms compete by offering low-edge variants—think infinite blackjack with unlimited seats at 0.45% or Lightning Roulette boosting payouts on straight-up bets to offset the base 2.7%, multipliers hitting 50x or 500x on lucky numbers, a mechanic that's exploded in popularity since 2020.
Platform Comparisons: RTP and Edges Vary by Market and Operator
Across platforms, RTPs and edges diverge sharply by jurisdiction; U.S. states like Pennsylvania report slot averages of 95.5% per state filings, while Michigan edges higher at 96.1%, reflecting operator choices in game libraries dominated by Pragmatic Play (averaging 96.5%) over IGT (94-95%). European operators under Malta oversight push 97% slots norms, aided by lighter regs, whereas Australian online proxies via offshore sites hover at 94-96%, constrained by strict land-based precedents from state bodies.
Canadian platforms, particularly Ontario's regulated market launched in 2022, mandate 85% minimum RTPs but average 95.8% for slots, with tables holding standard edges; live dealers there emphasize low-latency streams from North American studios, trimming blackjack edges to 0.4% on select tables. Experts observe that crypto casinos like Stake or BC.Game flaunt 98%+ RTP slots from providers like Hacksaw Gaming, but audits reveal variability, with house edges inflating during promotions disguised as boosts.
It's noteworthy that aggregator sites enable cross-platform hunting; players scouting Big Victory Casinos or similar note blackjack edges dipping below 0.5% on live Evolution tables, while slots cluster at 96.5%, a sweet spot compared to Vegas apps stuck at 94%. And in April 2026, fresh reports highlight a uptick—U.S. iGaming RTPs climbing 0.3% year-over-year amid competition, as operators refresh libraries with high-RTP drops like Gates of Olympus at 96.5%, fueling revenue that topped expectations despite seasonal dips.
Navigating the Numbers: Tools and Transparency Trends
Players armed with RTP calculators and probability charts gain edges in decision-making; sites like Casino.org list verified RTPs, while operator dashboards in regulated zones display real-time stats, helping bettors pick blackjack tables with 3:2 payouts over stingy 6:5. Observers who've tracked this note volatility indexes—low for steady drips, high for jackpot hunts—pair perfectly with bankroll strategies, turning abstract math into playable reality.
Yet regulatory pushes ensure fairness; April 2026 audits from Ontario's iGaming sector revealed 99% compliance on disclosed RTPs, with live edges audited via optical character recognition on streams, a tech that's catching subtle drifts. Platforms now integrate provably fair tech for RNG slots, letting users verify hashes post-spin, bridging trust gaps in an industry where one rogue operator's 90% RTP scandal in 2025 shook markets.
There's this case where a sharp bettor cross-referenced 50 platforms, landing on 97.2% average slots by prioritizing Swedish providers, a tactic data backs for maximizing returns over volume.
Conclusion: Grasping the Math Behind the Thrill
The realities of RTPs, table probabilities, and live edges paint a clear picture—slots deliver 92-98% long-haul returns laced with volatility, tables reward strategy with sub-1% edges on smart plays, and live dealers maintain parity while adding human flair, all varying by platform, jurisdiction, and title. As April 2026 data underscores upticks in transparency and competitive RTPs, players who decode these metrics position themselves best, chasing value amid the spins, deals, and rolls that define casino play. Knowledge of these figures, drawn from regulatory filings and provider specs, empowers informed sessions across digital landscapes.